Visualizing GeoJSON Data with Folium in Python
Geographic data visualization is one of the most powerful and interesting ways to tell stories with your data. A major text-based analysis often results in a boring and low-interactive output. Geographic data visualization can be a game changer to make your analysis more engaging and interesting. In this tutorial, we’ll explore how to create and visualize GeoJSON data, a popular open-source format for representing geographic data, using geojson.io and Folium in Python.
Introduction
During my capstone project 2 at Purwadhika Digital Technology School, I was handling data visualization project that is related to New York City Taxi and Limousine Commission (TLC) dataset.
What is GeoJSON?
GeoJSON is a format for encoding geographic data structures. It supports various geometry types like Point, LineString, Polygon, and other variants. Each feature can include properties that describe the geographic entity.
Here’s a simple example of a GeoJSON Point:
{
  "type": "Feature",
  "geometry": {
    "type": "Point",
    "coordinates": [125.6, 10.1]
  },
  "properties": {
    "name": "My Location"
  }
}
Here is the sample of GeoJSON data shapes:

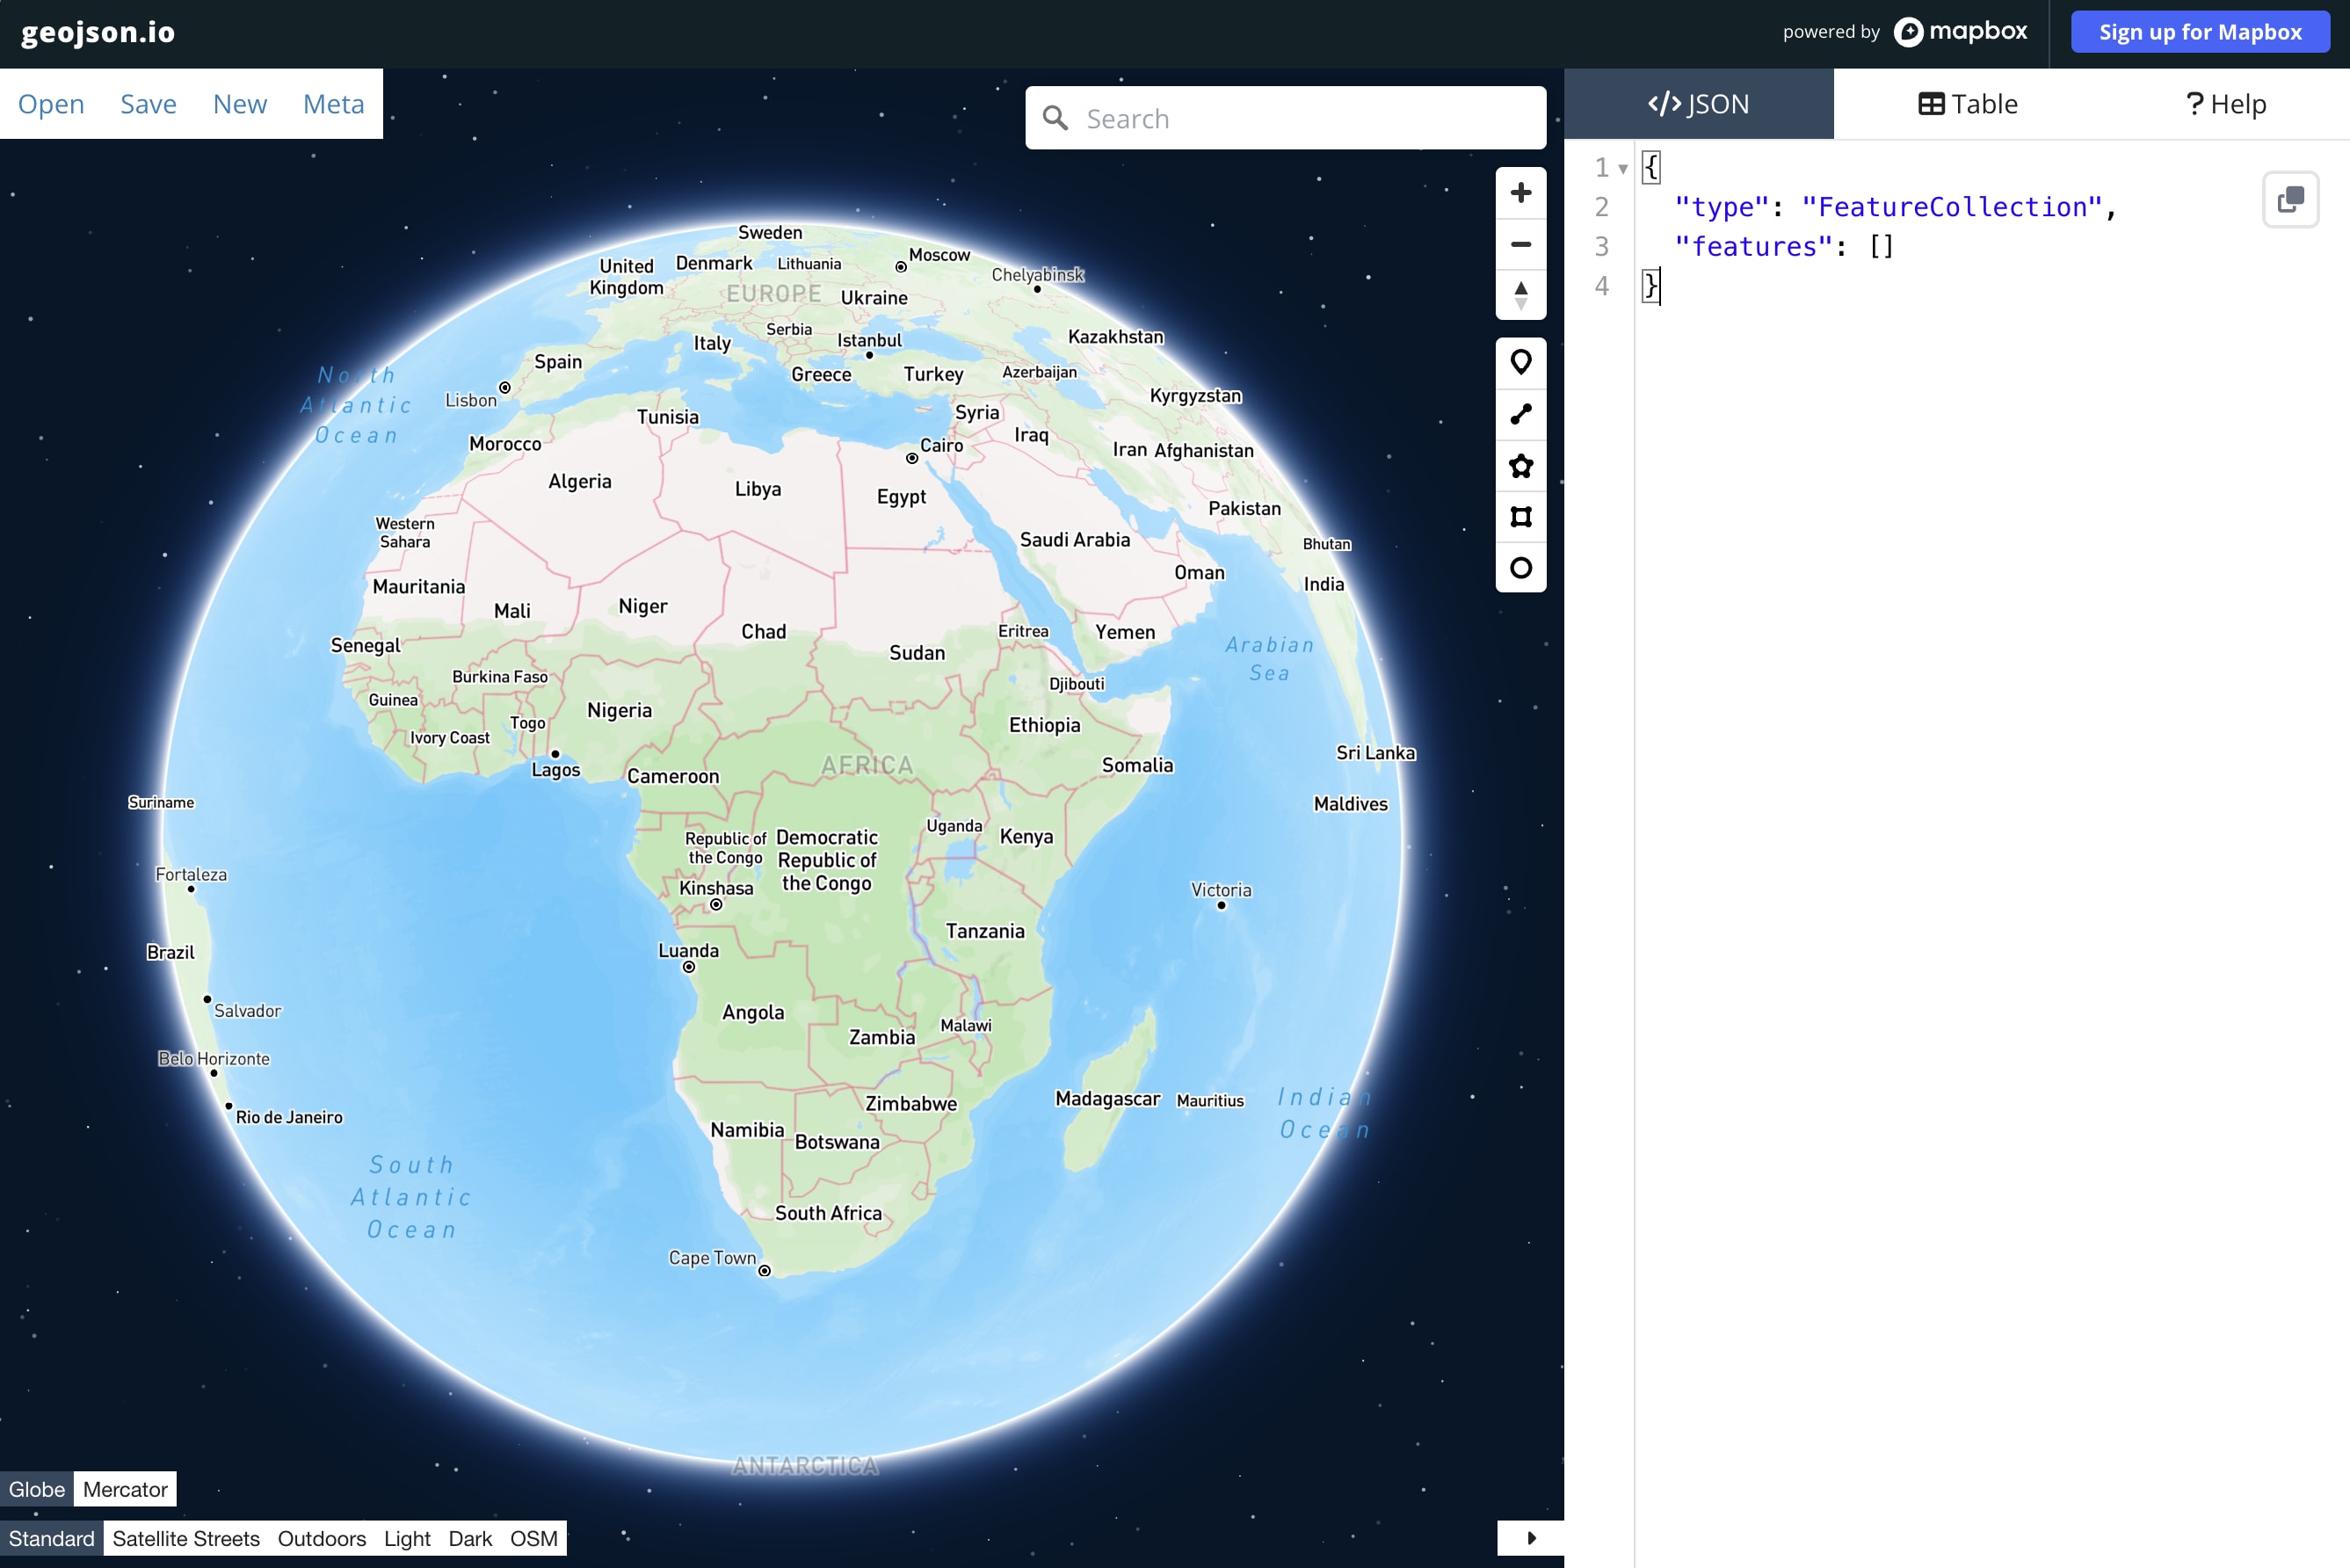
Getting Started with geojson.io
Geojson.io is a fantastic web tool for creating and editing GeoJSON data. It provides an interactive map interface where you can:
- Draw points, lines, and polygons
- Edit feature properties
- View and edit the raw GeoJSON
- Export your data in various formats
Try it out: Go to geojson.io to play around with your own geographic shapes and features!

GeoJSON Data Types
GeoJSON data types are the basic building blocks for creating geographic features and shapes. Here are the main types:
Point
A single point on the map:
{
  "type": "Feature",
  "geometry": {
    "type": "Point",
    "coordinates": [125.6, 10.1]
  }
}
LineString
A series of connected points, perfect for routes or paths:
{
  "type": "Feature",
  "geometry": {
    "type": "LineString",
    "coordinates": [
      [125.6, 10.1],  // First point
      [125.7, 10.2],  // Second point
      [125.8, 10.3]   // Third point
    ]
  }
}
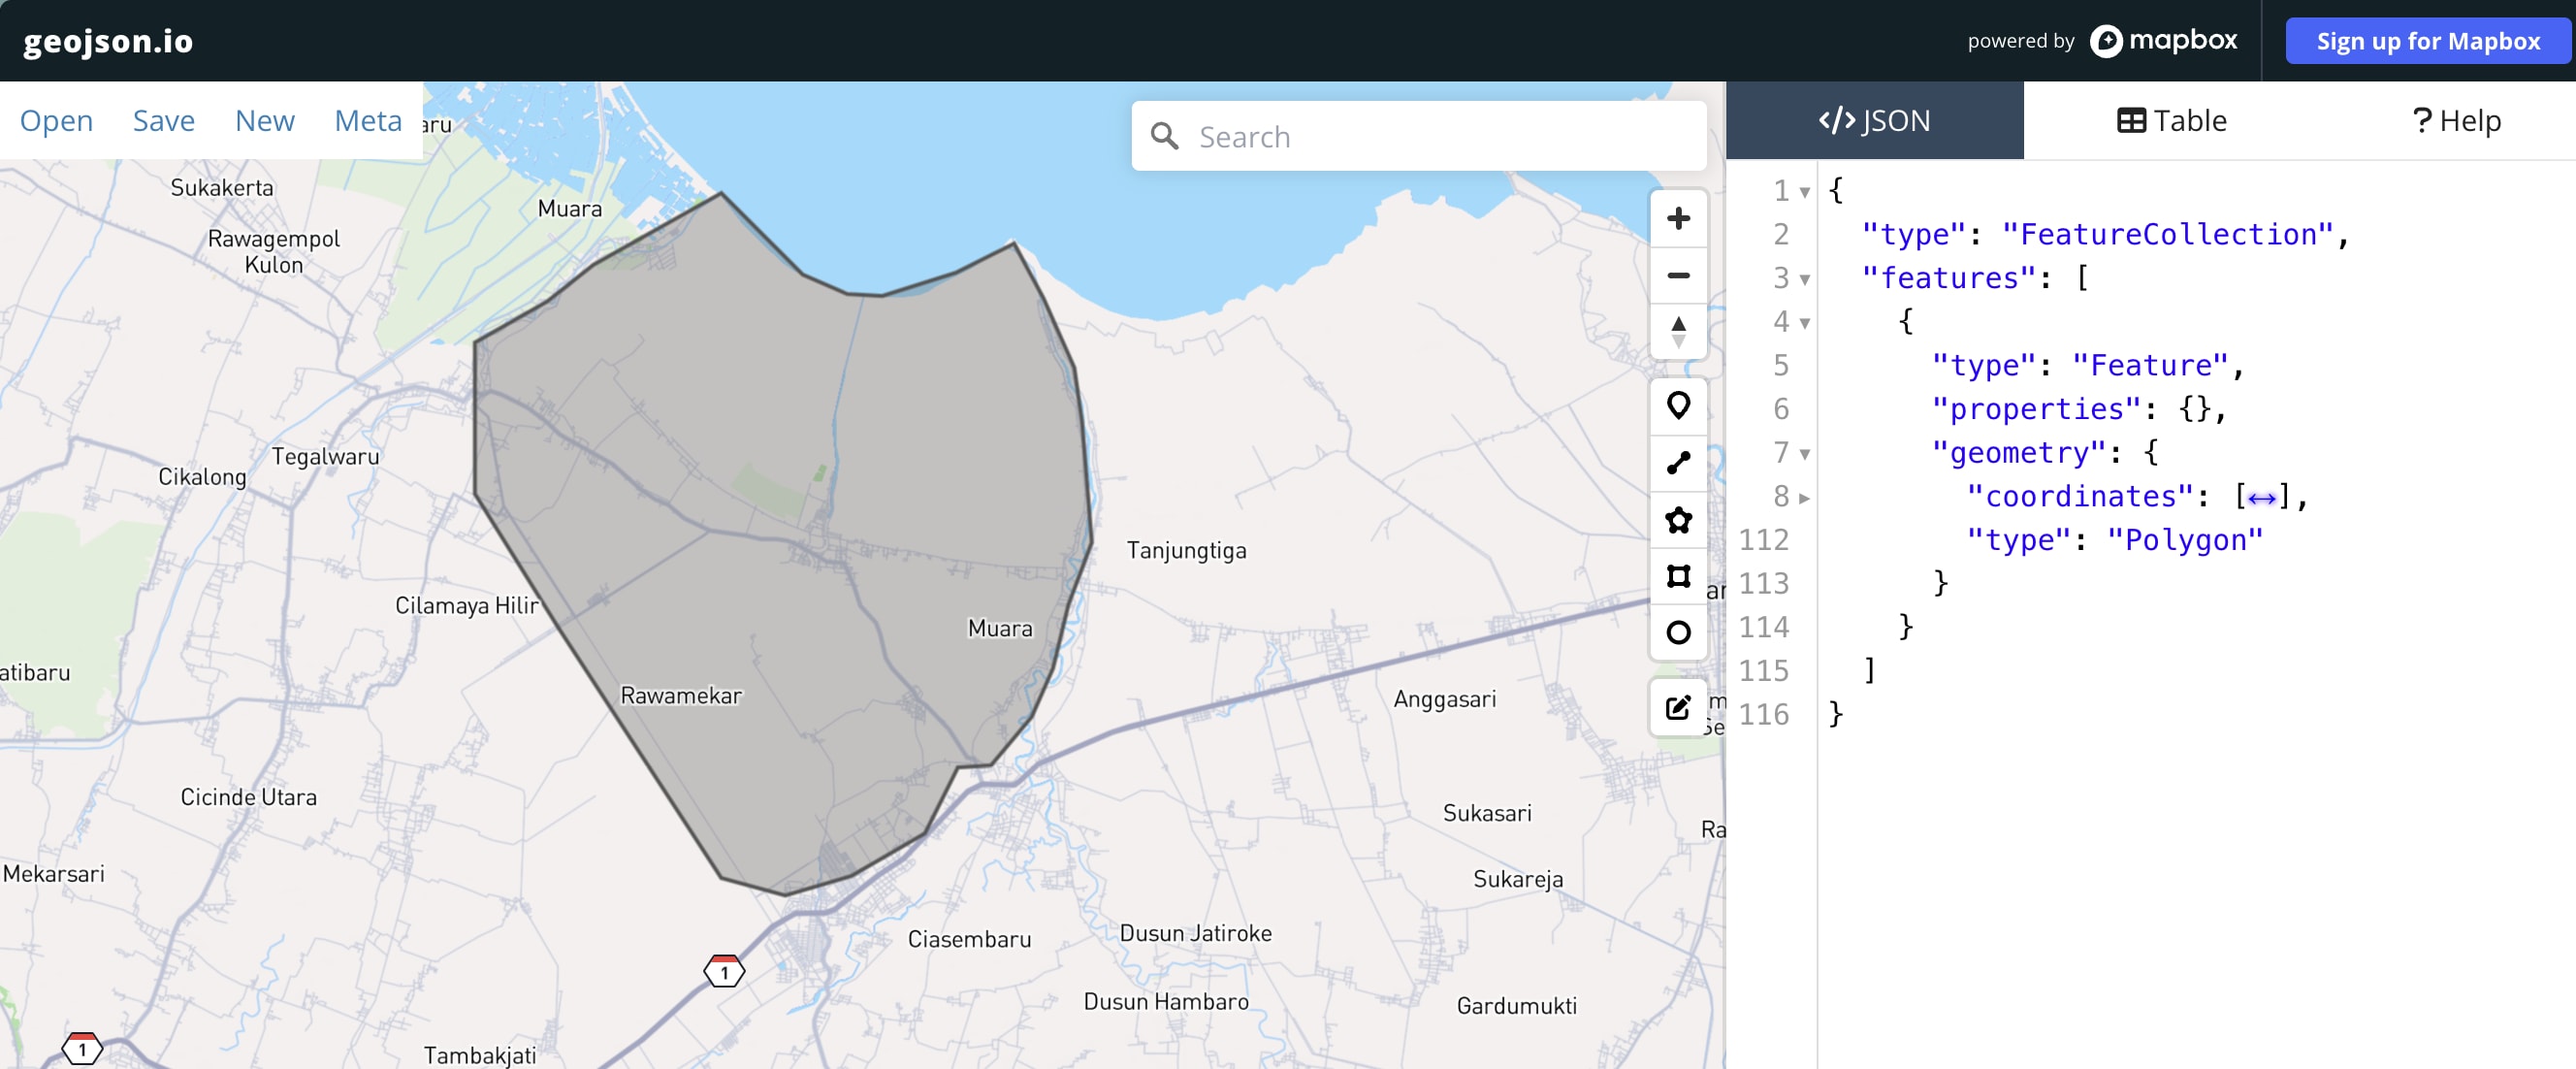
Polygon
A closed shape defined by a series of coordinates where the first and last points must be identical. This type is often used to represent areas like map areas, borders, parks, buildings, or administrative boundaries.
{
  "type": "Feature",
  "properties": {
    "name": "Contoh area Jawa Barat",
    "fill": "#43a2ca",
    "fill-opacity": 0.5
  },
  "geometry": {
    "type": "Polygon",
    "coordinates": [
          [
            [
              107.64405932374825,
              -6.214388326430054
            ],
            [
              107.62139744814783,
              -6.22701655769437
            ],
            [
              107.61315789978244,
              -6.233502172162886
            ],
            [
              107.6004587293919,
              -6.240671818944634
            ],
            [
              107.60046517112289,
              -6.267293462192981
            ]
          ]
        ],
  }
}
Here is the sample of Polygon shape:

MultiPoint
A collection of points. It is usually used to represent multiple points on the map, for example, a set of coordinates that represent a route or a set of locations.
{
  "type": "Feature",
  "geometry": {
    "type": "MultiPoint",
    "coordinates": [
      [125.6, 10.1],
      [125.7, 10.2]
    ]
  }
}
MultiLineString
MultiLineString is usually used to represent a route or a set of paths on the map.
{
  "type": "Feature",
  "geometry": {
    "type": "MultiLineString",
    "coordinates": [
      [[125.6, 10.1], [125.7, 10.2]],  // First line
      [[125.8, 10.3], [125.9, 10.4]]   // Second line
    ]
  }
}
MultiPolygon
MultiPolygon is usually used to represent multiple polygons on the map, i.e. collection of areas.
{
  "type": "Feature",
  "geometry": {
    "type": "MultiPolygon",
    "coordinates": [
      [[[125.6, 10.1], [125.7, 10.2], [125.8, 10.3], [125.6, 10.1]]],  // First polygon
      [[[125.9, 10.4], [126.0, 10.5], [126.1, 10.6], [125.9, 10.4]]]   // Second polygon
    ]
  }
}
FeatureCollection
A container for multiple features:
{
  "type": "FeatureCollection",
  "features": [
    {
      "type": "Feature",
      "geometry": {
        "type": "Point",
        "coordinates": [125.6, 10.1]
      },
      "properties": {
        "name": "Location A"
      }
    },
    {
      "type": "Feature",
      "geometry": {
        "type": "Point",
        "coordinates": [125.7, 10.2]
      },
      "properties": {
        "name": "Location B"
      }
    }
  ]
}
Remember that all coordinates in GeoJSON are in [longitude, latitude] order, which is different from the more common [latitude, longitude] format used in many mapping applications.
Styling Your Features
GeoJSON features can include styling properties that Folium will recognize. Add these under the “properties” key:
{
  "type": "Feature",
  "properties": {
    "color": "#ff7800",
    "weight": 5,
    "opacity": 0.65
  },
  "geometry": {
    "type": "LineString",
    "coordinates": [...]
  }
}
Saving Your GeoJSON
In geojson.io, you can save your work by:
- Clicking “Save”
- Choosing “GeoJSON” format
- Saving the file locally (e.g.,
route_data.geojson)
Visualizing with Folium
Now let’s bring our GeoJSON data to life with Folium! First, install the required packages:
import folium
import json
Create a base map and add your GeoJSON:
# Create a map centered on your data
m = folium.Map(location=[-6.1754, 106.8271], zoom_start=15)

# Load GeoJSON file that we created earlier
with open('route_data.geojson') as f:
    geojson_data = json.load(f)

# Add GeoJSON to map
folium.GeoJson(
    geojson_data,
    name='geojson'
).add_to(m)

# Add layer control
folium.LayerControl().add_to(m)

# show the map directly in Jupyter Notebook
display(m)

# Optionally, save the map to an HTML file
m.save('route_map.html')
You can enhance your visualization with tooltips:
folium.GeoJson(
    geojson_data,
    name='geojson',
    tooltip=folium.GeoJsonTooltip(
        fields=['name'],
        aliases=['Location:'],
        style=("background-color: white; color: #333333; font-family: arial; font-size: 12px; padding: 10px;")
    )
).add_to(m)
Advanced Features
Let’s add some interactivity with popup markers:
def style_function(feature):
    return {
        'fillColor': feature['properties'].get('fill', '#ff7800'),
        'color': feature['properties'].get('color', '#000000'),
        'weight': feature['properties'].get('weight', 2),
        'fillOpacity': feature['properties'].get('fill-opacity', 0.7),
    }

folium.GeoJson(
    geojson_data,
    style_function=style_function,
    highlight_function=lambda x: {'weight':3, 'fillOpacity':0.9},
    popup=folium.GeoJsonPopup(
        fields=['name', 'description'],
        aliases=['Name:', 'Description:'],
        localize=True,
        style='background-color: white;'
    )
).add_to(m)
This code creates an interactive map where:
- Features are styled based on their properties
- Hovering highlights the feature
- Clicking shows a popup with feature information
Conclusion
GeoJSON and Folium make a powerful combination for creating interactive maps in Python. Whether you’re visualizing routes, boundaries, or points of interest, these tools provide the flexibility and features you need.
Try experimenting with different geometry types, styling options, or shapes!
